1、JFreeChar基础
(1)概念
JFreeChart是一个Java开源项目,它是一款优秀的基于Java的图表开发组件,提供了在Java应用程序和JavaWeb应用程序下生成各种图表的功能,包括柱形图、饼形图、线图、区域图、时序图和多轴图等,这些图表可以JPEG、PNG等格式返回到应用程序中。
(2)部署安装
jfreechart-1.o.13.jar和jcommon-1.o.16.jar两个文件拷贝到Web应用程序的WEB-INF/lib
(3)核心类
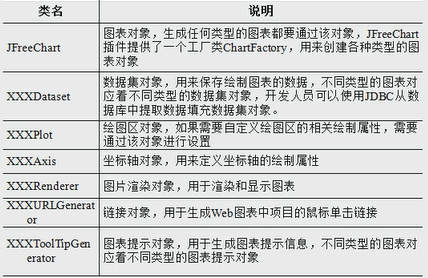
2、使用步骤
(1)导包
(2)配置文件
<?xml version="1.0" encoding="UTF-8"?>
<web-app xmlns:xsi="http://www.w3.org/2001/XMLSchema-instance"
    xmlns="http://java.sun.com/xml/ns/javaee"
    xsi:schemaLocation="http://java.sun.com/xml/ns/javaee http://java.sun.com/xml/ns/javaee/web-app_3_0.xsd"
    id="WebApp_ID" version="3.0">
    <display-name>Jfree</display-name>
    <welcome-file-list>
        <welcome-file>index.html</welcome-file>
        <welcome-file>index.htm</welcome-file>
        <welcome-file>index.jsp</welcome-file>
        <welcome-file>default.html</welcome-file>
        <welcome-file>default.htm</welcome-file>
        <welcome-file>default.jsp</welcome-file>
    </welcome-file-list>

    <servlet>
        <servlet-name>DisplayChart</servlet-name>
        <servlet-class>org.jfree.chart.servlet.DisplayChart</servlet-class>
    </servlet>
    <servlet-mapping>
        <servlet-name>DisplayChart</servlet-name>
        <url-pattern>/chart/DisplayChart</url-pattern>
    </servlet-mapping>
</web-app>
(3)测试程序
<%@ page language="java" contentType="text/html; charset=UTF-8"
pageEncoding="UTF-8"%>
<%@ page import="org.jfree.chart.ChartFactory,
org.jfree.chart.JFreeChart,
org.jfree.chart.plot.PlotOrientation,
org.jfree.chart.servlet.ServletUtilities,
org.jfree.data.category.CategoryDataset,
org.jfree.data.general.DatasetUtilities,
org.jfree.chart.plot.*,
org.jfree.chart.labels.*,
org.jfree.chart.renderer.category.BarRenderer3D,
java.awt.*,
org.jfree.ui.*,
org.jfree.chart.axis.AxisLocation,org.jfree.chart.title.TextTitle,org.jfree.chart.axis.CategoryAxis,org.jfree.chart.axis.NumberAxis"%>
<%
//使用数组定义报表数据,即数据集
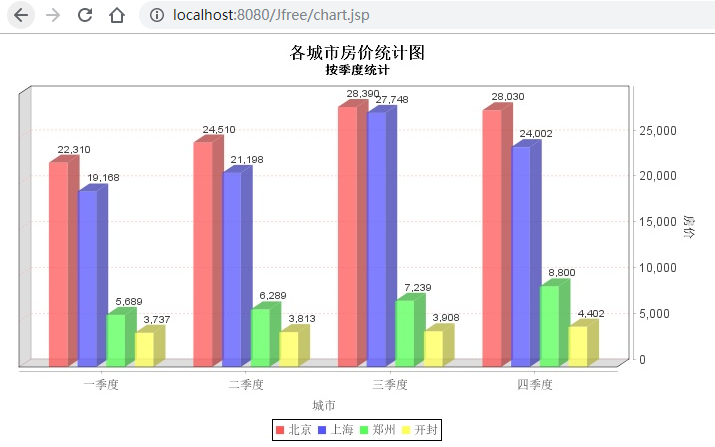
double[][] data = new double[][] {
{22310, 24510, 28390, 28030},
{19168, 21198, 27748, 24002},
{5689, 6289, 7239, 8800},
{3737,3813,3908,4402}};
String[] row = {"一季度", "二季度","三季度", "四季度"};
String[] column = {"北京", "上海", "郑州","开封"};
//为报表填充数据库
CategoryDataset dataset = DatasetUtilities.createCategoryDataset(column,row ,data);
//实例化一个3D柱状图
JFreeChart chart = ChartFactory.createBarChart3D("","城市","房价",dataset,PlotOrientation.VERTICAL,true,true,false);
//实例化plot对象
CategoryPlot plot = chart.getCategoryPlot();
//设置字体,不然中文将产生乱码
Font font = new Font("宋体", Font.BOLD, 16);
//定义标题
TextTitle title = new TextTitle("各城市房价统计图", font);
//定义副标题
TextTitle subtitle = new TextTitle("按季度统计", new Font("黑体", Font.BOLD, 12));
//添加副标题和标题
chart.addSubtitle(subtitle);
chart.setTitle(title);
//设置plot对象的X轴和Y轴
NumberAxis numberaxis = (NumberAxis) plot.getRangeAxis();
CategoryAxis domainAxis = plot.getDomainAxis();
//设置X轴坐标上的文字字体
domainAxis.setTickLabelFont(new Font("sans-serif", Font.PLAIN, 12));
//设置X轴的标题文字字体
domainAxis.setLabelFont(new Font("宋体", Font.PLAIN, 12));
//设置Y轴坐标上的文字字体
numberaxis.setTickLabelFont(new Font("sans-serif", Font.PLAIN, 12));
//设置Y轴的标题文字字体
numberaxis.setLabelFont(new Font("黑体", Font.PLAIN, 12));
//设置栏目文字字体
chart.getLegend().setItemFont(new Font("宋体", Font.PLAIN, 12));
//设置网格背景颜色
plot.setBackgroundPaint(Color.white);
//设置网格竖线颜色
plot.setDomainGridlinePaint(Color.BLUE);
//设置网格横线颜色
plot.setRangeGridlinePaint(Color.pink);
//显示每个柱的数值,并修改该数值的字体属性
BarRenderer3D renderer = new BarRenderer3D();
renderer.setBaseItemLabelGenerator(new StandardCategoryItemLabelGenerator());
renderer.setBaseItemLabelsVisible(true);
//默认的数字显示在柱子中,通过如下两行代码调整数字的显示
//注意:本行代码很重要,否则显示的数字会被覆盖
renderer.setBasePositiveItemLabelPosition(new ItemLabelPosition(ItemLabelAnchor.OUTSIDE12, TextAnchor.BASELINE_LEFT));
renderer.setItemLabelAnchorOffset(10D);
//设置每个地区所包含的平行柱的之间距离
plot.setRenderer(renderer);
//设置城市 、房价的显示位置
//将下方的“城市 ”放到上方
plot.setDomainAxisLocation(AxisLocation.BOTTOM_OR_RIGHT);
//将默认放在左边的“房价”放到右方
plot.setRangeAxisLocation(AxisLocation.TOP_OR_RIGHT);
//生成JPG格式的图片
String filename = ServletUtilities.saveChartAsJPEG(chart, 700, 400,null, session);
//图片生成的路径及名称
String graphURL = request.getContextPath() + "/chart/DisplayChart?filename=" + filename;
%>
<!DOCTYPE html>
<html>
<head>
<title>使用JFreeChart生成图表</title>
</head>
<body>
<img src="<%= graphURL %>" width=700 height=400 border=0 usemap="#<%= filename %>">
</body>
</html>
(4)测试