Spring Boot Actuator:健康检查、审计、统计和监控
Spring Boot Actuator可以帮助你监控和管理Spring Boot应用,比如健康检查、审计、统计和HTTP追踪等。所有这些特性可以通过JMX或者HTTP endpoint来获得。
Actuator同时还可以与外部应用监控系统整合,比如Prometheus, Graphite, DataDog, Influx, Wavefront, New Relic等。这些系统提供了非常好的仪表盘、图标、分析和告警等功能,使得你可以通过统一的接口轻松的监控和管理你的应用。
Actuator使用Micrometer来整合上面提到的外部应用监控系统。这使得只要通过非常小的配置就可以集成任何应用监控系统。
我将把Spring Boot Actuator教程分为两部分:
- 第一部分(本文)教你如何配置Actuator和通过Http endpoints来进入这些特征。
- 第二部分教你如何整合Actuator和外部应用监控系统。
创建一个有Actuator的Spring Boot工程
首先让我们建一个依赖Actuator的简单应用。maven依赖如下:
<dependencies>
    <dependency>
        <groupId>org.springframework.boot</groupId>
        <artifactId>spring-boot-starter-web</artifactId>
    </dependency>

    <dependency>
        <groupId>org.springframework.boot</groupId>
        <artifactId>spring-boot-starter-actuator</artifactId>
    </dependency>
</dependencies>
使用Actuator Endpoints来监控应用
Actuator创建了所谓的endpoint来暴露HTTP或者JMX来监控和管理应用。
举个例子
/health的endpoint,提供了关于应用健康的基础信息。/metricsendpoint展示了几个有用的度量信息,比如JVM内存使用情况、系统CPU使用情况、打开的文件等。/loggerendpoint展示了应用的日志和可以让你在运行时改变日志等级。
值得注意的是,每一个actuator endpoint都可以显示的打开或关闭。此外这些endpoint也需要通过HTTP或者JMX暴露出来,使得它们能被远程进入。
让我们运行应用并且尝试进入默认通过HTTP暴露的打开状态的actuator endpoints。之后我们将学习如何打开更多的endpoints并且通过HTTP暴露它们。
创建应用
让我们启动actuator应用,应用默认使用8080端口运行。
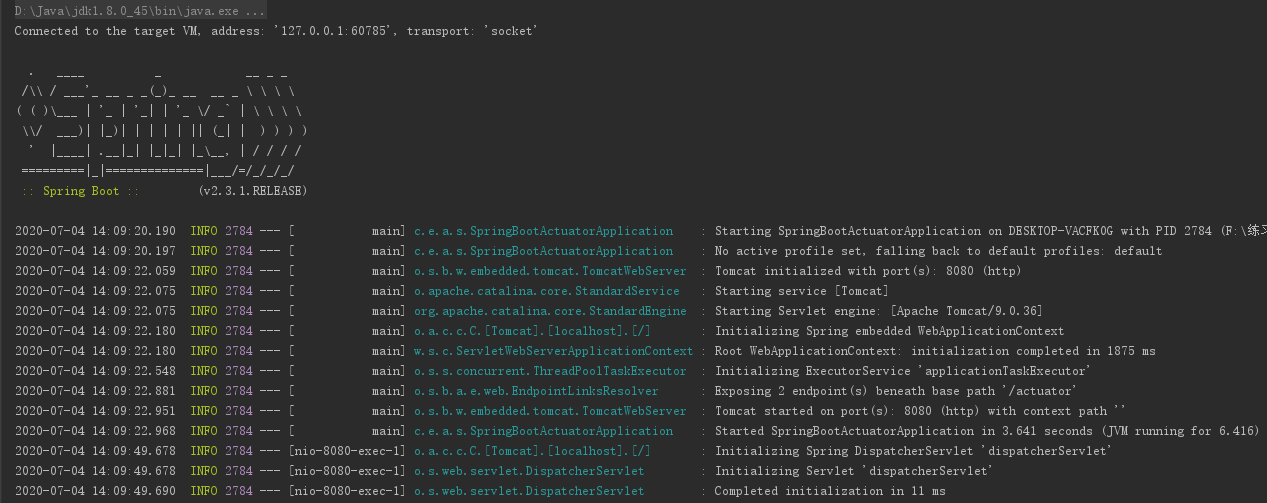
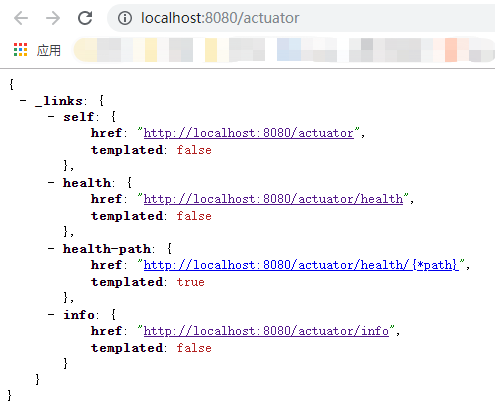
启动成功之后,可以通过http://localhost:8080/actuator来展示所有通过HTTP暴露的endpoints。
打开http://localhost:8080/actuator/health,则会显示如下内容:
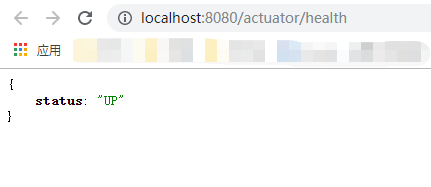
状态将是UP只要应用是健康的,如果应用不健康将会显示DOWN,比如与仪表盘的连接异常或者缺失磁盘空间等。下一节我们将学习Spring Boot如何决定应用的健康和如何修复这些健康问题。
info endpoint(http://localhost:8080/actuator/info)展示了关于应用的一般信息,这些信息从编译文件,比如META-INFO/build-info.properties,或者GIT文件,比如git.properties或者任何环境的property中获取。你将在下一节中学习如何改变这个endpoint的输出。
**默认,只有health和info通过HTTP暴露了出来。**这也是为什么/actuator页面只展示了health和infoendpoints。我们将学习如何暴露其他endpoint。首先,让我们看看其他的endpoints是什么。
常用actuator endpoints列表
以下是一些非常有用的actuator endpoints列表。你可以在official documentation上面看到完整的列表。
| Endpoint ID | Description |
|---|---|
| auditevents | 显示应用暴露的审计事件 (比如认证进入、订单失败) |
| info | 显示应用的基本信息 |
| health | 显示应用的健康状态 |
| metrics | 显示应用多样的度量信息 |
| loggers | 显示和修改配置的loggers |
| logfile | 返回log file中的内容(如果logging.file或者logging.path被设置) |
| httptrace | 显示HTTP足迹,最近100个HTTP request/repsponse |
| env | 显示当前的环境特性 |
| flyway | 显示数据库迁移路径的详细信息 |
| liquidbase | 显示Liquibase 数据库迁移的详细信息 |
| shutdown | 让你逐步关闭应用 |
| mappings | 显示所有的@RequestMapping路径 |
| scheduledtasks | 显示应用中的调度任务 |
| threaddump | 执行一个线程dump |
| heapdump | 返回一个GZip压缩的JVM堆dump |
打开和关闭Actuator Endpoints
默认,上述所有的endpoints都是打开的,除了shutdownendpoint。
你可以通过设置management.endpoint..enabled to true or false(id是endpoint的id)来决定打开还是关闭一个actuator endpoint。
举个例子,要想打开shudownendpoint,增加以下内容在你的application.properties文件中:
management.endpoint.shutdown.enabled=true
暴露Actuator Endpoints
默认,所有的actuator endpoint通过JMX被暴露,而通过HTTP暴露的只有health和info。
- 通过HTTP暴露actuator endpoints。
    # Use "*" to expose all endpoints, or a comma-separated list to expose selected ones
    management.endpoints.web.exposure.include=health,info
    management.endpoints.web.exposure.exclude=
- 通过JMX暴露actuator endpoints。
    # Use "*" to expose all endpoints, or a comma-separated list to expose selected ones
    management.endpoints.jmx.exposure.include=*
    management.endpoints.jmx.exposure.exclude=
通过设置management.endpoints.web.exposure.include为*,我们可以在http://localhost:8080/actuator页面看到如下内容。
{
    "_links":{
        "self":{
            "href":"http://localhost:8080/actuator",
            "templated":false
        },
        "beans":{
            "href":"http://localhost:8080/actuator/beans",
            "templated":false
        },
        "caches-cache":{
            "href":"http://localhost:8080/actuator/caches/{cache}",
            "templated":true
        },
        "caches":{
            "href":"http://localhost:8080/actuator/caches",
            "templated":false
        },
        "health":{
            "href":"http://localhost:8080/actuator/health",
            "templated":false
        },
        "health-path":{
            "href":"http://localhost:8080/actuator/health/{*path}",
            "templated":true
        },
        "info":{
            "href":"http://localhost:8080/actuator/info",
            "templated":false
        },
        "conditions":{
            "href":"http://localhost:8080/actuator/conditions",
            "templated":false
        },
        "shutdown":{
            "href":"http://localhost:8080/actuator/shutdown",
            "templated":false
        },
        "configprops":{
            "href":"http://localhost:8080/actuator/configprops",
            "templated":false
        },
        "env":{
            "href":"http://localhost:8080/actuator/env",
            "templated":false
        },
        "env-toMatch":{
            "href":"http://localhost:8080/actuator/env/{toMatch}",
            "templated":true
        },
        "loggers":{
            "href":"http://localhost:8080/actuator/loggers",
            "templated":false
        },
        "loggers-name":{
            "href":"http://localhost:8080/actuator/loggers/{name}",
            "templated":true
        },
        "heapdump":{
            "href":"http://localhost:8080/actuator/heapdump",
            "templated":false
        },
        "threaddump":{
            "href":"http://localhost:8080/actuator/threaddump",
            "templated":false
        },
        "metrics-requiredMetricName":{
            "href":"http://localhost:8080/actuator/metrics/{requiredMetricName}",
            "templated":true
        },
        "metrics":{
            "href":"http://localhost:8080/actuator/metrics",
            "templated":false
        },
        "scheduledtasks":{
            "href":"http://localhost:8080/actuator/scheduledtasks",
            "templated":false
        },
        "mappings":{
            "href":"http://localhost:8080/actuator/mappings",
            "templated":false
        }
    }
}
解析常用的actuator endpoint
/health endpoint
/health endpoint通过合并几个健康指数检查应用的健康情况。
Spring Boot Actuator有几个预定义的健康指标,比如DataSourceHealthIndicator、DiskSpaceHealthIndicator、MongoHealthIndicator、RedisHealthIndicator、CassandraHealthInditor等。它使用这些健康指标作为健康检查的一部分。
举个例子,如果你的应用使用Redis,RedisHealthIndicator将被当作检查的一部分。如果使用Mongo,那么MongoHealthIndicator将被当作检查的一部分。
你也可以关闭特定的健康检查指标,比如在properties中使用如下命令:
management.health.mongo.enabled=false
默认,所有的这些健康指标被当做检查的一部分。
显示详细的健康信息
health endpoint只展示了简单的UP和DOWN状态。
为了获得健康检查中所有指标的详细信息,你可以通过在application.properties中增加如下内容:
management.endpoint.health.show-details=always
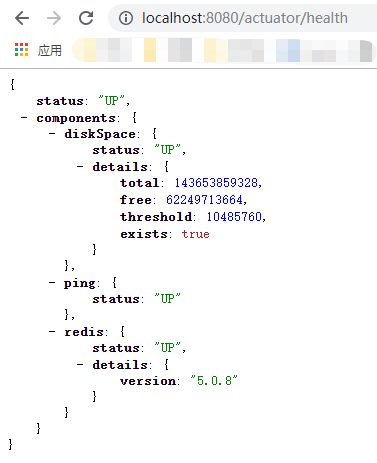
一旦打开上述开关,你可以在http://localhost:8080/actuator/health中看到如下详细内容:
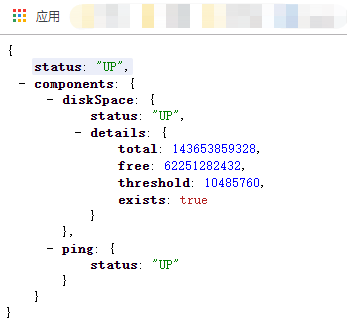
health endpoint现在包含了DiskSpaceHealthIndicator。
如果你的应用包含Redis,health endpoints将显示如下内容:
创建一个自定义的健康指标
你可以通过实现HealthIndicator接口来定义一个健康指标,或者继承AbstractHealthIndicatior类。
package com.example.actuator.springbootactuator;

import org.springframework.boot.actuate.health.AbstractHealthIndicator;
import org.springframework.boot.actuate.health.Health;
import org.springframework.stereotype.Component;

@Component
public class CustomHealthIndicator extends AbstractHealthIndicator {
    @Override
    protected void doHealthCheck(Health.Builder builder) throws Exception {
        // Use the builder to build the health status details that should be reported.
        // If you throw an exception, the status will be DOWN with the exception message.

        builder.up()
                .withDetail("app", "Alive and Kicking")
                .withDetail("error", "Nothing! I'm good.");
    }
}
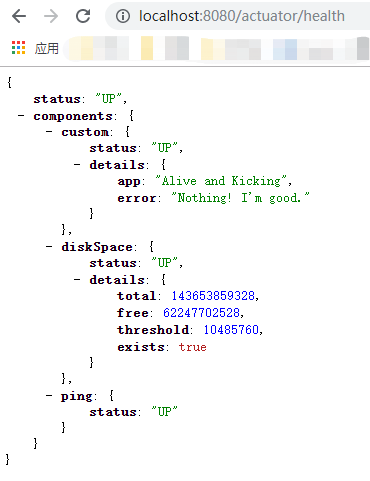
一旦你增加上面的健康指标到你的应用中去,health endpoints将展示如下细节:
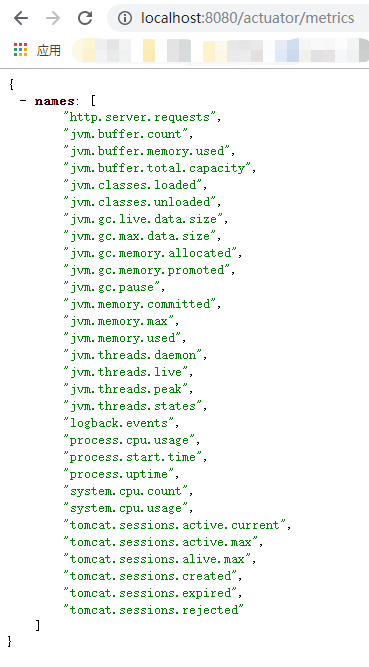
/metrics endpoint
metrics endpoint展示了你可以追踪的所有度量。
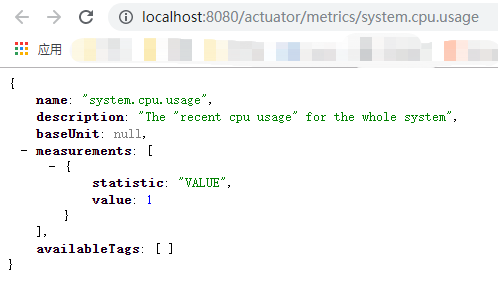
想获得每个度量的详细信息,你需要传递度量的名称到URL中,像http://localhost:8080/actuator/metrics/{MetricName}
举个例子,获得system.cpu.usage的详细信息,使用URL http://localhost:8080/actuator/metrics/system.cpu.usage。
它将显示如下内容:
/loggers endpoint
loggers endpoint,可以通过访问http://localhost:8080/actuator/loggers来进入。他展示了应用中可配置的loggers的列表和相关日志等级。
你同样能够使用http://localhost:8080/actuator/loggers/{name}来展示特定logger的细节。
举个例子,为了获得root logger的细节,你可以使用http://localhost:8080/actuator/loggers/ROOT:
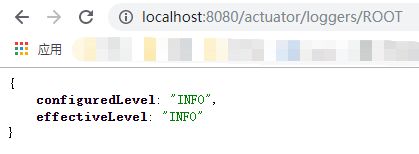
在运行时改变日志等级
loggers endpoint也允许你在运行时改变应用的日志等级。
举个例子,为了改变root logger的等级为DEBUG,发送一个POST请求到http://localhost:8080/actuator/loggers/ROOT,加入如下参数
{
   "configuredLevel": "DEBUG"
}
这个功能对于线上问题的排查非常有用。
同时,你可以通过传递null值给configuredLevel来重置日志等级。
/info endpoint
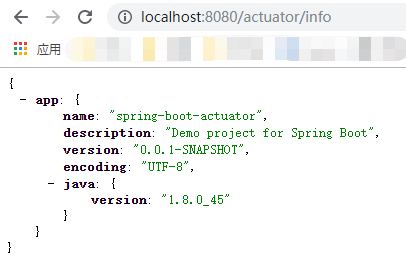
/info endpoint展示了应用的基本信息。它通过META-INF/build-info.properties来获得编译信息,通过git.properties来获得git信息。它同时可以展示任何其他信息,只要这个环境property中含有info key。
你可以增加properties到application.properties中,比如:
# INFO ENDPOINT CONFIGURATION
info.app.name=@project.name@
info.app.description=@project.description@
info.app.version=@project.version@
info.app.encoding=@project.build.sourceEncoding@
info.app.java.version=@java.version@
注意,我使用了Spring Boot的Automatic property expansion 特征来扩展来自maven工程的properties。
一旦你增加上面的properties,info endpoint将展示如下信息:
注解方式自定义Endpoint
编写自定义endpoint
@Endpoint(id = "my-endpoint")
public class MyEndpoint {
@ReadOperation
public Map<String, Object> endpoint() {
Map<String, Object> map = new HashMap<>(16);
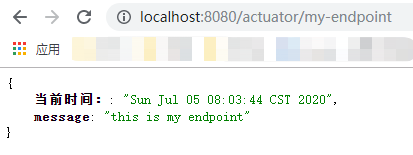
map.put("当前时间:", new Date().toString());
map.put("message", "this is my endpoint");
return map;
}
}
编写配置类
@Configuration
public class EndpointConfiguration {

    @Bean
    public MyEndpoint endpoint() {
        return new MyEndpoint();
    }
}
结果
注意
@EndPoint中的id不能使用驼峰法,需要以-分割- Spring Boot会去扫描
@EndPoint注解下的@ReadOperation,@WriteOperation,@DeleteOperation注解,分别对应生成Get/Post/Delete的Mapping。注解中有个produces参数,可以指定media type, 如:application/json等。
使用Spring Security来保证Actuator Endpoints安全
Actuator endpoints是敏感的,必须保障进入是被授权的。如果Spring Security是包含在你的应用中,那么endpoint是通过HTTP认证被保护起来的。
如果没有,你可以增加以下依赖到你的应用中去:
<dependency>
   <groupId>org.springframework.boot</groupId>
   <artifactId>spring-boot-starter-security</artifactId>
</dependency>
接下来让我们看一下如何覆写spring security配置,并且定义你自己的进入规则。
下面的例子展示了一个简单的spring security配置。它使用叫做EndPointRequest的RequestMatcher工厂模式来配置Actuator endpoints进入规则。
package com.example.actuator.springbootactuator;

import org.springframework.boot.actuate.autoconfigure.security.servlet.EndpointRequest;
import org.springframework.boot.actuate.context.ShutdownEndpoint;
import org.springframework.boot.autoconfigure.security.servlet.PathRequest;
import org.springframework.context.annotation.Configuration;
import org.springframework.security.config.annotation.web.builders.HttpSecurity;
import org.springframework.security.config.annotation.web.configuration.WebSecurityConfigurerAdapter;

@Configuration
public class ActuatorSecurityConfig extends WebSecurityConfigurerAdapter {

    @Override
    protected void configure(HttpSecurity http) throws Exception {
        http
                .authorizeRequests()
                .requestMatchers(EndpointRequest.to(ShutdownEndpoint.class))
                .hasRole("ACTUATOR_ADMIN")
                .requestMatchers(EndpointRequest.toAnyEndpoint())
                .permitAll()
                .requestMatchers(PathRequest.toStaticResources().atCommonLocations())
                .permitAll()
                .antMatchers("/")
                .permitAll()
                .antMatchers("/**")
                .authenticated()
                .and().httpBasic();
    }

}
为了能够测试以上的配置,你可以在application.propert中增加spring security用户。
# Spring Security Default user name and password
spring.security.user.name=actuator
spring.security.user.password=actuator
spring.security.user.roles=ACTUATOR_ADMIN
下一部分:Spring Boot Metrics监控之Prometheus&Grafana